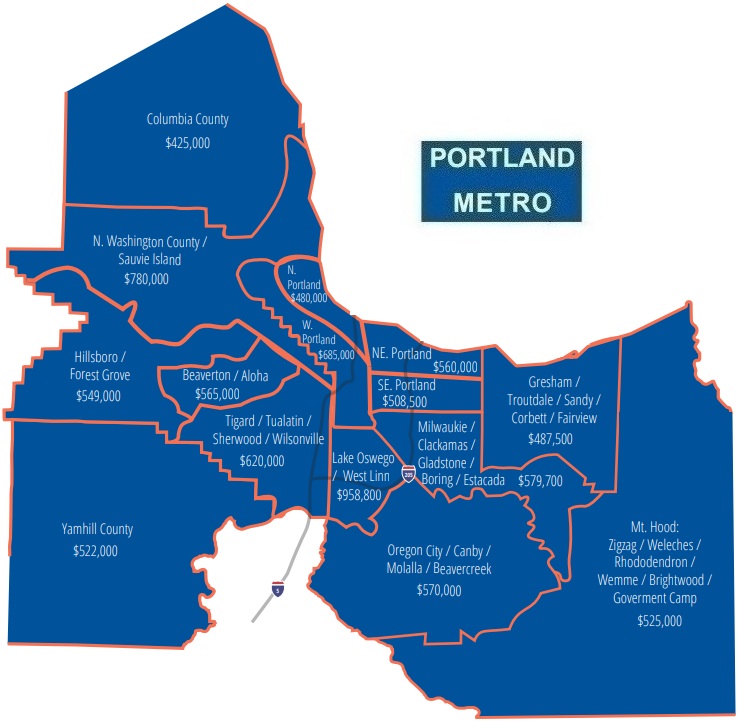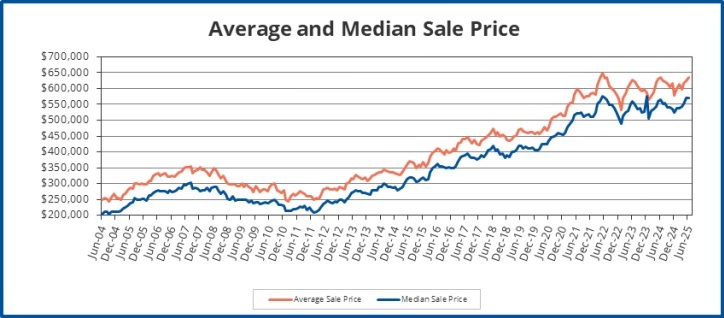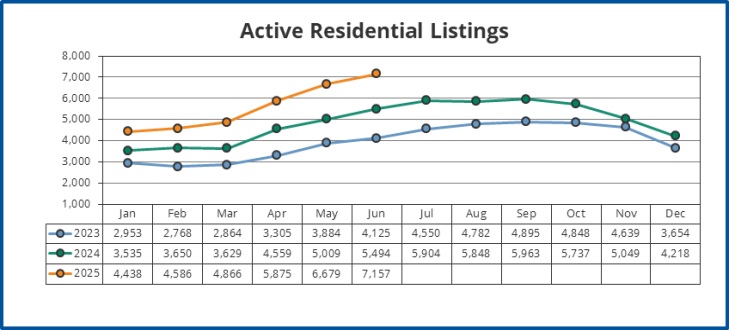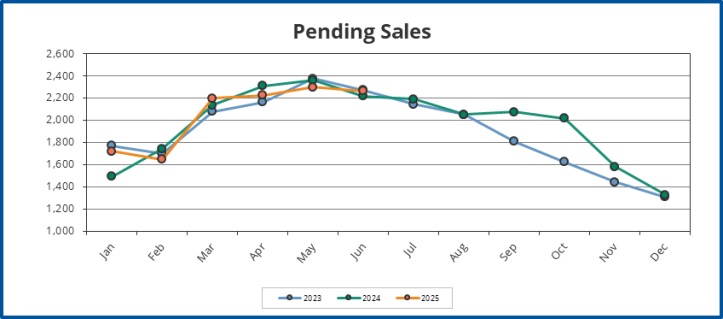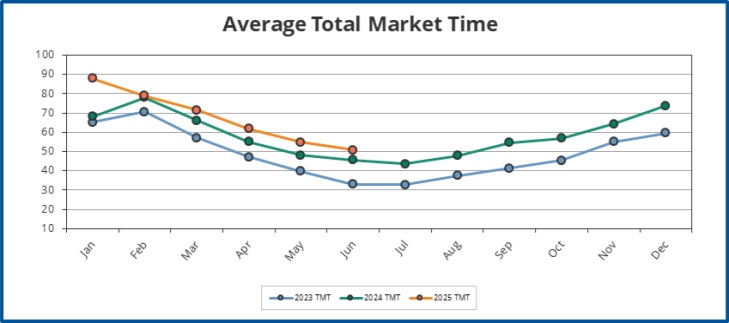
The average home price in the Portland Metro rose 1.5% in June. The inventory of active listings rose to 3.6 months for the Portland Metro area as a whole. Interestingly, inventory on the coast is significantly higher than in Portland itself. We are seeing balanced market conditions – leaning towards a buyer’s market – with 5.6 months of inventory in the Northern Coastal Communities, which comprise all the coastal towns from Astoria down to Yachats. If anyone is thinking about buying a coastal home, my team services a lot of the Oregon Coast. Given coastal housing inventory has been elevated throughout all of 2025, this might be a good time to look for opportunities. The Portland condo market continues to weaken with the inventory of active condo listings jumping to 8 months in June. The increase in condo inventory was due to the number of listings that went under contract in June dropping while the gross number of condos listed for sale rose to just under 1400 units. Condo prices dropped 3% last month as this played out. This does mean the market for houses is strong in the Portland Metro given condos are dragging down the statistics and we still have seen close to a 10% increase in the average sale price so far in 2025. There normally is strong seasonal strength in the front half of the year before prices start to gradually decrease in the late summer and fall. Whether we see seasonal weakness in home prices this fall will depend on mortgage rates. There is a scenario where the housing market tightens as more economic data comes out. However, there are still too many unknowns at this stage to predict if that will occur.
The 30 year fixed rate averaged 6.74% across the United States this week. Mortgage rates have remained in the upper 6% range since the last time rates briefly dipped in March. It could be argued that pressure on the Federal Reserve to lower rates has actually had the opposite effect, with most of the Fed Board of Governors being increasingly cautious given uncertainty about the eventual impacts of tariffs and the recent spending bill on the rate of inflation. Inflation appears to be slightly accelerating with the Consumer Price Index (CPI) rising to 2.7% on an annual basis in June. This is only 0.7% above the Fed’s 2% target but the number did swing the wrong direction. Core CPI, which excludes more volatile food and energy prices, came in at 2.9% in June. There is still some easing of prices needed before inflation is no longer the Federal Reserve’s main consideration on when to drop rates. Keeping the labor market stable is the other mandate of the Federal Reserve. The U.S. economy added 147,000 jobs in June which sounds positive. However, I have noticed a trend where the initial job gains reported by the Bureau of Labor Statistics have been repeatedly revised downwards over time. For instance, there were 818,000 fewer jobs gained between April 2023-March 2024 than were initially reported. Since that announcement last year, it’s become harder to find accurate data. From piecing together data from several sources, it appears job gains were later revised downward by 145,000 jobs from April through December last year. From January through May of this year, the initially reported job numbers have already been revised downwards by 138,000 jobs. The reason this matters is the U.S. labor market has been gradually slowing over the last few years. Over the last 12 months, job gains have averaged 146,000 jobs per month. Over the prior 12 months, the U.S. economy averaged over 200,000 in job gains per month. Looking back further, from July 2022 through June 2023 the U.S. economy averaged closer to 300,000 jobs gained per month. We could see job losses show up in the data eventually if these trends continue.
On June 26th, the second GDP estimate for the first quarter was revised downwards to show the U.S. economy shrank 0.5%. On July 30th, the first estimate of Q2 GDP will be reported. If it’s negative, that would be a formal signal the U.S. economy is in a recession. While two consecutive quarters of negative GDP growth is the most common definition of a recession according to economists, there are other considerations such as the health of the labor market. Entrenched price increases from past inflation don’t factor into that. It is more based upon the overall direction things are heading. The Atlanta Fed’s GDPNow model is projecting 2.4% growth in the 2nd quarter so the chances of a recession are still probably 50/50 at best. However, that doesn’t mean this potential outcome shouldn’t be on people’s radar when making financial decisions. While there is an outside chance we could see news headlines of a recession as early as August, if we are in one it appears to be a very mild one at this stage. That doesn’t mean the stock market and bond market might not react, which could bring down mortgage rates. If the bond market starts pricing in several rate cuts, mortgage rates staying in the 6-7% range is probably unsustainable. A drop in rates would increase housing affordability for approximately 60-70% of prospective buyers. While a recession would result in more job losses, it could open up a window for many families who missed the last low rate environment to buy real estate. Whether something like this plays out in 2025 or at the end of the Federal Reserve Chairman Jerome Powell’s term in May 2026 is yet to be seen. It does appear the government wants rates to fall even if it leads to more inflation in the medium term. We won’t necessarily have to see a large economic slowdown to get lower interest rates by mid-2026 at the end of Powell’s term, short lived as that may be given the implications for inflation.
If the benchmark lending rate is dropped prematurely, we could see a big run in prices of not just housing but everything we use on a daily basis. This is exactly what happened during the late 1970’s and early 1980’s, when a second wave of inflation hit the U.S. economy after rates were prematurely dropped by the Fed with too much inflationary pressure still present. Real estate can be a shield for that. It’s the only stable asset that can be purchased with only a 5% down payment or even a 3-3.5% down payment in some cases. This provides leverage to rising prices. For example, if someone bought a $500,000 house with a 5% down payment today, their initial investment would be $25,000 plus closing costs. In some instances, I am able to negotiate the seller to pay the buyer’s closing costs partially or in full. Let’s say the buyer’s cash to close would be $35,000 with no seller closing cost credit. If we see only a 6% increase in home prices for 3 consecutive years, which is in line with the historical average, the homes value would increase 19%. That’s before we look at how much the mortgage is paid down or tax deductions for mortgage interest and property taxes. You can also designate office space in the home for an additional tax deduction. Under this scenario, the value of the home will have risen $95,508 and that should be tax-free if it’s your primary residence. The first $250,000 of capital gains for a single homeowner, or $500,000 for a married couple, are exempt from taxes on just their main residence. I always advise talking to a CPA about what deductions are available to you. The equity in the home, including paying down the mortgage would be over $130,000 by mid-2028 if the purchase closed today and we see 6% annual appreciation for 3 years. All from only initially investing $35,000. In many cases I can get the initial investment down to $25,000-$30,000 with shrewd negotiating. This is how many of my clients have seen their net worth jump dramatically over the years. The rising value of your home won’t help pay for more expensive groceries or gas, but it can shield you from inflation by increasing your net worth when prices rise.